Machine Learning - Moving Linear Regression
About the Moving Linear Regression
This type of regression to be used when data of sub periods are different inside periods. For example, hours of day, days of week, months of year.
For example, the variance of the frequency of people in a commercial mall varies when comparing the days of the week. The same applies to an amount of cars on downtown or roads when comparing the days in a week, or even when comparing months, due to holidays and vacancies.
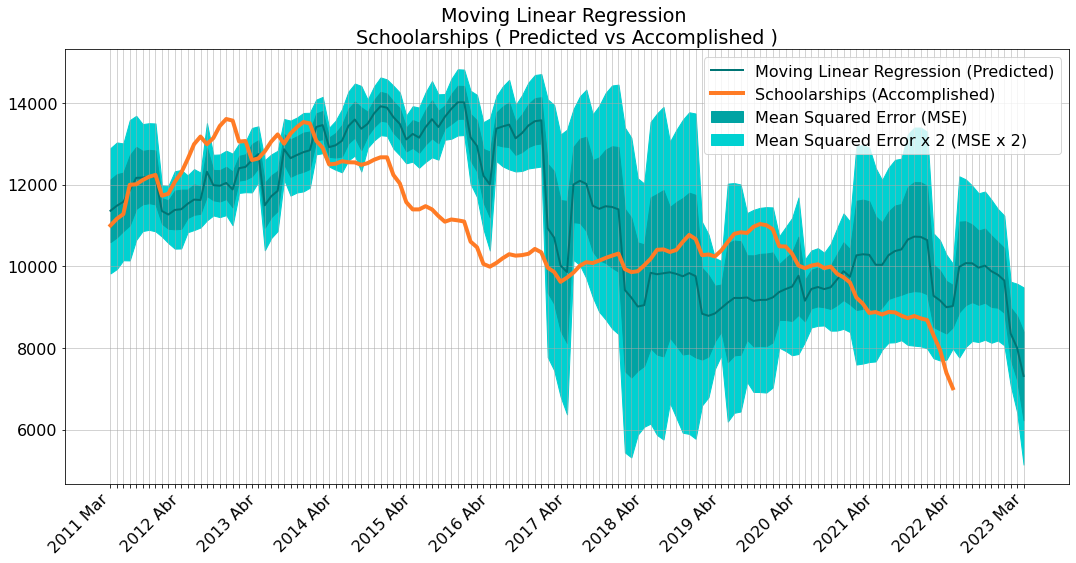
The chart bellow displays a seven year Moving Linear Regression applied to each month, for the number of ongoing research projects.

About the data
The data is public available on the open government initiative of the State of São Paulo - Brazil.Any results, partial information or charts presented here should not be interpreted as official information. These is just machine learning technology test. For official data, check the links above.
Machine Learning commented code
Basic imports
Basic Python data science libraries- Scikit Learn
- NumPy
- Pandas
- Matplotlib
import json
import pandas as pd
import numpy as np
from datetime import datetime

from sklearn import linear_model
from sklearn.model_selection import train_test_split
from sklearn.metrics import mean_squared_error, r2_score

import matplotlib.pyplot as plt
from matplotlib.ticker import FuncFormatter

today = datetime.now()
Data preparation
Get and transform data to make a dataframe compatible with the machine learning data model shape.
def ano_mes_zero(row):
    if len(str(row['ano_mes'])) < 6:
        mes_dig = row['ano_mes'] - int(row['ano']) * 10
        return int('{}0{}'.format(row['ano'], mes_dig))
    else:
        return row['ano_mes']

def add_zero(today):
    if today.month < 10:
       return '0{}'.format(str(today.month))


df = pd.read_json("< DATA FILE >")
df = pd.DataFrame (df['format_compatible'])

df[['ano', 'mes', 'aux', 'bol', 'ano_mes']] = pd.DataFrame(df.format_compatible
.tolist(), index= df.index)

df = df.drop('format_compatible', axis=1)
df[['aux', 'bol', 'ano_mes']] = df[['aux', 'bol', 'ano_mes']].astype(int)
df['ano_mes_zero'] = df.apply (lambda row: ano_mes_zero(row), axis=1)
date_filter = int('{}{}'.format(today.year, add_zero(today) ))
df = df[df['ano_mes_zero'] <= date_filter]
Linear Regression Model
Linear Regression model, from Scikit Learn.
def lin_reg(x, y):
    X = (x.index -  x.index[0]).values.reshape(-1, 1)
    X_train, X_test, y_train, y_test = train_test_split(
        X, y, test_size=0.33, random_state=42)
    regr = linear_model.LinearRegression()
    regr.fit(X_train, y_train)
    y_pred = regr.predict(X)
    return (X, y_pred, regr)
Apply Linear Regression Model to Data
After data gets transformed, applyes Linear Regression to a moving dataset of the months.
def get_months_seq(tf):
    """ Months - moving sequence """
    months = ['Jan', 'Fev', 'Mar', 'Abr', 'Mai', 'Jun', 'Jul', 'Ago', 'Set', 'Out', 'Nov', 'Dez']
    month_today_idx = int(today.strftime("%m"))-1
    month_actual = [months[month_today_idx]]
    months_before_split = months[:month_today_idx]
    months_after_split = months[month_today_idx+1:]

    if tf == 7:
        seq = months_after_split + months_before_split + month_actual + months_after_split + months_before_split + month_actual
        seq *= 6
        seq.pop(-1)
    elif tf == 21:
        seq = months_after_split + months_before_split + month_actual + months_after_split + months_before_split
    return ( month_actual[0], seq[::-1] )


def plot_line(df_slc_rev, proj):
    dataFrame = pd.DataFrame(df_slc_rev, columns=["ano", proj])
    dataFrame.plot(x="ano", y=[proj], kind="line", figsize=(10, 5))


def calc_regression(df_slc_rev, proj, plot_charts):
    (X, y_pred, regr) = lin_reg(x=df_slc_rev[proj], y=df_slc_rev[proj])
    if plot_charts:
        plt.plot(X, y_pred, color="blue", linewidth=1)
    mse = mean_squared_error(df_slc_rev[proj], y_pred, squared=False )
    return (X[-1] + 1, regr, mse)

def calc_prediction(x, regr, std, plot_charts=False):
    next_predict = ( x, regr.intercept_ + ( regr.coef_ * x ))
    if plot_charts:
        plt.errorbar(next_predict[0], next_predict[1], std, marker='o', capsize=4)

def calc_projects(df_slc_rev, proj, lst_predict, plot_charts=False):
    if plot_charts:
        plot_line(df_slc_rev, proj)

    (x, regr, mse) = calc_regression(df_slc_rev, proj, plot_charts)

    if plot_charts:
        calc_prediction(x, regr, mse, plot_charts)
        plt.grid(lw=0.3)
        print(proj,": ", idx, month, year_predict)
        plt.show()

    lst_predict['mes'].append( month )
    lst_predict['mlr'].append( regr.intercept_ + ( regr.coef_ * x )[0] )
    lst_predict['mse'].append( mse )
Build data
Loop trough data, to apply the Logistic Regression to the moving dataset.
timeframe = 7

(month_actual, months) = get_months_seq(timeframe)
lst_predict_aux = {'mes':[], 'mlr':[], 'mse':[]}
lst_predict_bol = {'mes':[], 'mlr':[], 'mse':[]}

year_predict = 0
for idx, month in enumerate(months):
    if idx > 0 and (month == 'Dez'):
        year_predict += 1

    df_month = df.loc[df['mes'] == month]
    df_month.reset_index(drop=True, inplace=True)
    df_slc_rev = slice_sample(timeframe, year_predict, df_month)
    df_slc_rev.reset_index(drop=True, inplace=True)

    # plot_charts arguments - to view each charts month individually
    calc_projects(df_slc_rev, 'aux', lst_predict_aux, plot_charts=False)
    calc_projects(df_slc_rev, 'bol', lst_predict_bol, plot_charts=False)
Plot chart
Plot data to chart- Moving Linear Regression
- Prediction
- Deviation
# print( lst_predict_aux )

def plot_final(proj, lst_predict_mse):
    if proj == 'aux':
        lst_predict = lst_predict_aux
        label = 'Research Grants'
    else:
        lst_predict = lst_predict_bol
        label = 'Schoolarships'

    lst_predict = pd.DataFrame.from_dict(lst_predict)
    dataFrame = pd.DataFrame(lst_predict[::-1], columns=["mes", "mlr", "mse"])

    mlr = dataFrame.reset_index(drop=True)
    accomplished = (df[len(mlr)-12::-1].reset_index(drop=True))

    final_data = mlr.join(accomplished[[proj, 'ano']], how='left')
	last_year = int(final_data.iloc[final_data['ano'].last_valid_index()]['ano'])
    final_data['ano'] = final_data['ano'].fillna(str(last_year+1))

    # Plot chart
    font = {'size': 16}
    plt.figure(figsize=(18, 8))
    plt.rc('font', **font)
    plt.title("Moving Linear Regression \n" + label + ' ( Predicted vs Accomplished )')

    final_data['mlr'].plot(linewidth=2, color='#007575', label='Moving Linear Regression (Predicted)')

    plt.fill_between(final_data.index.values, final_data['mlr'] - (final_data['mse'] * 2),
                      final_data['mlr'] + (final_data['mse'] * 2), color="#00D1D1", label="Mean Squared Error x 2 (MSE x 2)")
    plt.fill_between(final_data.index.values, final_data['mlr'] - (final_data['mse']),
                      final_data['mlr'] + (final_data['mse']), color="#00A3A3", label="Mean Squared Error (MSE)")

    final_data['ano_mes'] = np.where(final_data['mes'] != month_actual, \
                                '', \
                                final_data['ano']+' ' + month_actual)

    final_data.loc[0, 'ano_mes'] = final_data['ano'][0] + ' Mar'
    final_data.iloc[-1, final_data.columns.get_loc('ano_mes')] = final_data.iloc[-1]['ano'] + ' Mar'
    final_data[proj].plot(linewidth=4, color='#FF7B25', label=label + ' (Accomplished)')

    plt.xticks(np.arange(final_data.shape[0])[::1], final_data['ano_mes'][::1], rotation=45, ha='right')
    plt.locator_params(axis='x')
    plt.grid(linewidth=0.5, color='#A9A9A9')

    handles, labels = plt.gca().get_legend_handles_labels()
    order = [0,3,2,1]
    plt.legend([handles[idx] for idx in order],[labels[idx] for idx in order])


plot_final('aux', lst_predict_aux)
plot_final('bol', lst_predict_bol)
Charts
Starting from a Linear Regression, one of the most simple regression models, this script creates a Moving Linear Regression, and apllies to predict two datasets, Reserch Grants and Scholarships.
