Dynamic data use-case for d3.js
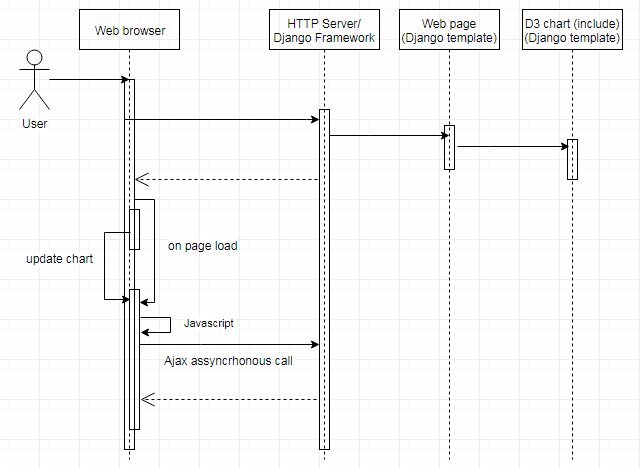
I have been using d3.js in a production environment for about 3 years. And now due to some features upgrade on our website some changes need to be made on our charts. I decided to put this on paper to document and share this experiments. To play with d3.js, you have to deal with some technologies: Javascript Css Ajax Server-side (Python/Django) for me For this system I also use Solr to deliver graph data. System overview The portal ( https://bv.fapesp.br ) is a standard web site that loads dynamic data from relational database and nosql database. To display analytics charts, we use d3.js. The diagram below shows the communication layer between the components, to load d3.js charts on the front-end of BV FAPESP. Essentially, we use d3.js just like that, a javascript framework to display chart data. However, when you have to load data dynamically in a couple of charts, these things need to be a bit elaborated. BV FAPESP portal makes use of some d3.js charts seemin...