Dynamic data use-case for d3.js
I have been using d3.js in a production environment for about 3 years. And now due to some features upgrade on our website some changes need to be made on our charts. I decided to put this on paper to document and share this experiments.
To play with d3.js, you have to deal with some technologies:
To play with d3.js, you have to deal with some technologies:
- Javascript
- Css
- Ajax
- Server-side (Python/Django) for me
- For this system I also use Solr to deliver graph data.
System overview
The portal (https://bv.fapesp.br) is a standard web site that loads dynamic data from relational database and nosql database. To display analytics charts, we use d3.js.
The diagram below shows the communication layer between the components, to load d3.js charts on the front-end of BV FAPESP.
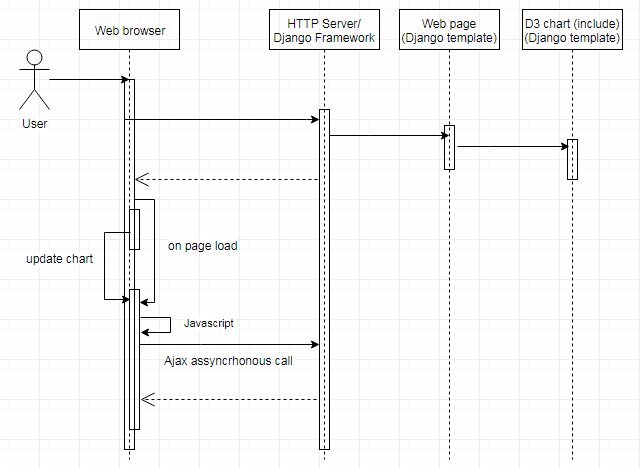
Essentially, we use d3.js just like that, a javascript framework to display chart data. However, when you have to load data dynamically in a couple of charts, these things need to be a bit elaborated. BV FAPESP portal makes use of some d3.js charts seemingly basics, as line chart, bar chart, and stacked bar. Further on we will see that these simple charts holds some tricky things to display dynamic data.
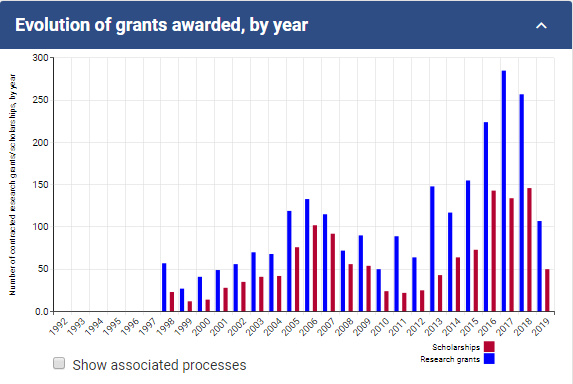
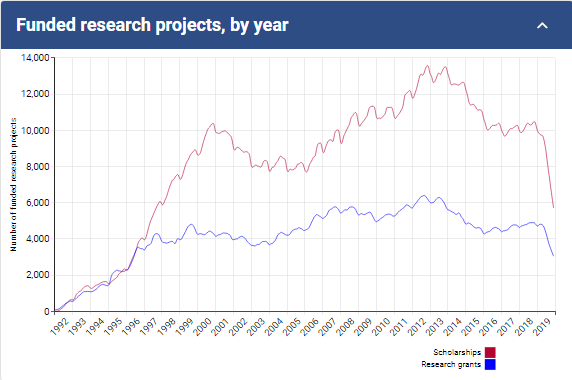
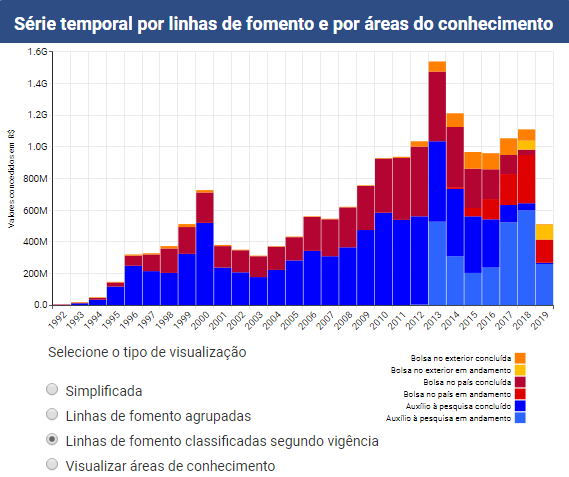
For external usage, we are making two charts available, while for internal usage we have other charts for administrative analysis.
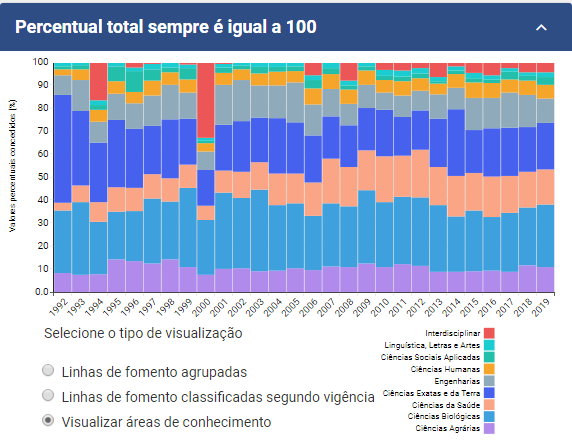
On the next picture, I identified these common elements with numbers and borders
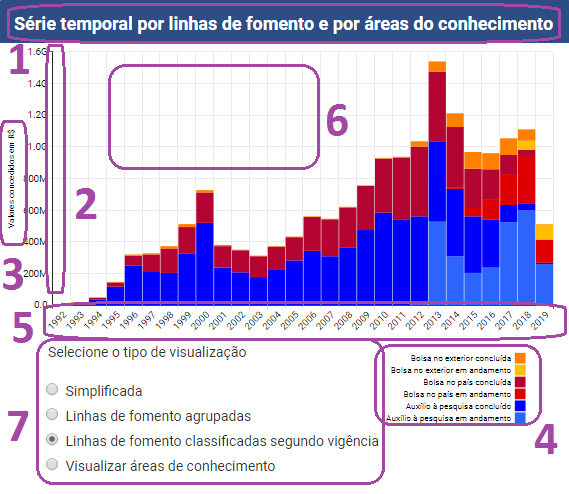
The common elements identified above:
For my use-case, the user can perform three actions as shown on the diagram below:

At the first page load, the whole process is executed and the chart is displayed with the default selected dataset.
Here the data has already been loaded to the browser´s data container, and the javascript just changes the data on the chart
This action works fine for small dataset, and it is nice for presentation, since the chart shows the data immediately because it is has been all loaded at once on the web browser.
Essentially, we use d3.js just like that, a javascript framework to display chart data. However, when you have to load data dynamically in a couple of charts, these things need to be a bit elaborated. BV FAPESP portal makes use of some d3.js charts seemingly basics, as line chart, bar chart, and stacked bar. Further on we will see that these simple charts holds some tricky things to display dynamic data.
For external usage, we are making two charts available, while for internal usage we have other charts for administrative analysis.
External use charts
For external users BV FAPESP makes available these charts:Internal usage charts
SVG elements
As you can see in the four charts above, despite being for internal or external usage, they share some SVG elements in common.On the next picture, I identified these common elements with numbers and borders
The common elements identified above:
- Chart name
- x and y axis
- Axis labels
- Subtitles
- Axis values
- Grid
- This is not SVG, we will see this later.
Data management
To build your own d3.js library, you have to deal with some steps to manage your data, according to your needs.For my use-case, the user can perform three actions as shown on the diagram below:
Use-cases description
Page loadAt the first page load, the whole process is executed and the chart is displayed with the default selected dataset.
- Ajax call
- Update data container (first load)
- Default selection displays data (Show Chart)
Here the data has already been loaded to the browser´s data container, and the javascript just changes the data on the chart
This action works fine for small dataset, and it is nice for presentation, since the chart shows the data immediately because it is has been all loaded at once on the web browser.
- Reload chart
Get more data
This action is better for large data processing at the backend, to not lock the browser while processing.
This class receives a SVG object and manipulates this object on this methods:
They are a very simple templates, included on parent templates where needed. These individual templates have the HTML elements, header, divs, forms and tables.
The div element is used to render the SVG chart. The other HTML elements are used to display extra information that you need, and more important, they are used to display the command buttons, as the radio buttons displayed on the former image as number 7.
The number 1, the chart title is an HTML div element too, apart the SVG element.
This is not considered a best practice, but if you have a small dev team and you want to turn things more practical, you can do this.
To initialize the object of my class, I need a a SVG object. Again, I do this all in one place, to have everything on my hand.
I can call each method bellow separately, or I can call them at once when changeData is has been fired.

This action is better for large data processing at the backend, to not lock the browser while processing.
- Ajax call
- Update data container
- Reload chart
Data container
In order to make this features, create a data container at the Ajax level, so you can store and update data as needed.Custom d3.js library overview
A small javascript class
To handle the SVG elemens of the charts, I wrote a small library. Which is acctually a javascript class with some methods. This way you can setup the elements in one place only. For example,to change the size of the fonts, the placement of any element, type of scale, grid color etc.This class receives a SVG object and manipulates this object on this methods:
- init()
- renderAxis()
- renderGrid()
- renderSubtitle()
- changeData()
- showTip()
- svgBorder()
Python/Django template
I am using Python/Django and choose to make specific HTML template for each chart.They are a very simple templates, included on parent templates where needed. These individual templates have the HTML elements, header, divs, forms and tables.
The div element is used to render the SVG chart. The other HTML elements are used to display extra information that you need, and more important, they are used to display the command buttons, as the radio buttons displayed on the former image as number 7.
The number 1, the chart title is an HTML div element too, apart the SVG element.
Javascript / d3.js
To manage your d3.js charts, you have to write some javascript code, which you can include inline in your HTMLs, since these templates are individual for each chart.This is not considered a best practice, but if you have a small dev team and you want to turn things more practical, you can do this.
Create SVG and initialize the object
To initialize the object of my class, I need a a SVG object. Again, I do this all in one place, to have everything on my hand.
- HTML div element
- Javascript
- d3.js lib
Render chart
When the user changes the selection of data to display, you can choose what to change on the screen. For the user perspective it is the same if you change the data only, or you change the entire SVG. It is really fast to render svg.I can call each method bellow separately, or I can call them at once when changeData is has been fired.
- renderAxis()
- renderGrid()
- renderSubtitle()
- changeData()
- showTip()
- svgBorder()
