Machine Learning - Classification problem
SciKit Learn library data classification problem.
This experiment was split in two posts/notebooks, because the texts, code and outputs are extensive.
To complement this experiment, I wisht to propose a real classification prediction scenario for this problem, and a minimum viable product for data analysis machine learning based, in the near future.
This first post talks about Data analysis and the second one << yet to come >> talks about Selecting the Model for Prediction
Data Analysis
Just after data loading, you have to analyse it to clean, merge and transform to make it machine learning friendly.
Check every variable to get a good idea of the kind of data is there on the dataset. Numerical or categorical? Continuous or discrete?
And after the data fits the right layout, you have to analyse other aspects like its dimmensionality, correlations and repetitions, to make another transformation to work good with your models.
So, let's jump into it.
Commented Code
Common data science libraries
Importing Python libraries to analyse data and try machine learning models.- Scikit Learn
- NumPy
- Pandas
- Matplotlib
- Seaborn
About the data
The data is public available on the open government initiative of the State of São Paulo - Brazil.Any results, partial information or charts presented here should not be interpreted as official information. These is just machine learning technology test. For official data, check the links above.
About the problem
Given a set of research grants and it's features, lets try to classify those into two classes. Will it generate a scientific publication? Yes or No? A binary classification.
The dataset download above, is a subset containing the years of the research grants ended up until 2016, 17, 18, 19 and 2020.
from sklearn.model_selection import train_test_split

import matplotlib.pyplot as plt
import seaborn as sns
import pandas as pd
import numpy as np

# To avoid this, sometimes bug, SettingWithCopyWarning
pd.options.mode.chained_assignment = None

# Dois arquivos baixados da BV.
# Total de auxilos regulares finalizados em 2016, 17,18,19,20
# Auxilos regulares com publicações científicas finalizados em 2016, 17,18,19,20
aux_total = <all_research_grants>
aux_com_pub = <research_granth_with_publications>


# Clean up data
df_total = pd.read_csv(aux_total, sep=";", header = 0)
df_total = df_total.loc[:, ~df_total.columns.str.contains('^Unnamed')]
cols = df_total.columns
cols = cols.map(lambda x: x.replace(' ', '_'))
cols = cols.map(lambda x: x.replace('.', ''))
df_total.columns = cols

df_com_pub = pd.read_csv(aux_com_pub, sep=";", header = 0)
df_com_pub = df_com_pub.loc[:, ~df_com_pub.columns.str.contains('^Unnamed')]
cols = df_com_pub.columns
cols = cols.map(lambda x: x.replace(' ', '_'))
cols = cols.map(lambda x: x.replace('.', ''))
df_com_pub.columns = cols

df_y = df_total.assign(com_pub=df_total.N_Processo.isin(df_com_pub.N_Processo).astype(int))

cols = [0, 3, 4, 9, 11, 16, 17,21, 22, 25, 29, 37, 38, 39, 40]
df_clean = df_y[df_y.columns[cols]]

# Remove not needed naming
df_clean['Instituição'].replace('\(Brasil\)','', regex=True, inplace=True)
df_clean['Instituição'] = df_clean['Instituição'].apply(lambda st: st[st.find("(")+1:st.find(")")])

# Convert datetime and add a new feature duration_date
df_clean['Data_de_Início'] = pd.to_datetime(df_clean['Data_de_Início'])
df_clean['Data_de_Término'] = pd.to_datetime(df_clean['Data_de_Término'])
df_clean['duration_date'] = df_clean['Data_de_Término'] - df_clean['Data_de_Início']
df_clean['duration_date'] = df_clean['duration_date'].astype(int)

# Target class - Acctual values
df_clean['com_pub'].value_counts()
One Hot Encoding
Moving categorical data in one column to related columns with numeric values 0 or 1.
This is made in order to avoid distortion while comparing data with strong scale differences, among other reasons.
There are a lot of information about this, on the Internet. Check this link, which explais some basics about normalizing data to values between zero and one:
def normalize_0_1(df_normalized: pd.DataFrame) -> pd.DataFrame:
    df_normalized = df_normalized.fillna(0)
    df_normalized = (df_normalized - df_normalized.min()) / (df_normalized.max() - df_normalized.min())
    return df_normalized

df_normalized = df_clean.copy(deep=True)

# Pesquisadores_Associados
df_normalized['Pesquisadores_Associados'] = df_normalized['Pesquisadores_Associados'].str.split('-').str.len()
df_normalized['Pesquisadores_Associados'] = normalize_0_1(df_normalized['Pesquisadores_Associados'])

# # Processos_Vinculados
df_normalized['Processos_Vinculados'] = df_normalized['Processos_Vinculados'].str.split(';').str.len()
df_normalized['Processos_Vinculados'] = normalize_0_1(df_normalized['Processos_Vinculados'])

# # País_(Instituições_no_Exterior)
df_normalized['País_(Instituições_no_Exterior)'] = df_normalized['País_(Instituições_no_Exterior)'].str.split(',').str.len()
df_normalized['País_(Instituições_no_Exterior)'] = normalize_0_1(df_normalized['País_(Instituições_no_Exterior)'])

# duration_date
df_normalized['duration_date'] = normalize_0_1(df_normalized['duration_date'])

# Grantee infos
df_normalized[['GoogleMyCitations_(Beneficiário)', 'ResearcherID_(Beneficiário)', 'Orcid_(Beneficiário)']] = np.where(df_normalized[['GoogleMyCitations_(Beneficiário)', 'ResearcherID_(Beneficiário)', 'Orcid_(Beneficiário)']].isnull(), 0, 1)

df_normalized
	N_Processo	Beneficiário	Instituição	Pesquisador_Responsável	Pesquisadores_Associados	Linha_de_Fomento	Grande_Área_do_Conhecimento	Data_de_Início	Data_de_Término	País_(Instituições_no_Exterior)	Processos_Vinculados	GoogleMyCitations_(Beneficiário)	ResearcherID_(Beneficiário)	Orcid_(Beneficiário)	com_pub	duration_date
0	19/14807-0	Sérgio Kurokawa	UNESP	Sérgio Kurokawa	0.043478	Auxílio à Pesquisa - Regular	Engenharias	2019-12-01	2020-11-30	0.000000	0.000000	1	1	1	1	0.134380
1	19/21108-0	Luis Carlos Uta Nakano	UNIFESP	Luis Carlos Uta Nakano	0.000000	Auxílio à Pesquisa - Regular	Ciências da Saúde	2019-12-01	2020-11-30	0.000000	0.000000	0	0	0	0	0.134380
2	19/01649-7	Eduardo José Grin	FGV	Eduardo José Grin	0.000000	Auxílio à Pesquisa - Regular	Ciências Sociais Aplicadas	2019-11-01	2020-12-31	0.000000	0.166667	1	1	1	0	0.164296
3	19/17890-5	Massimo Di Felice	USP	Massimo Di Felice	0.000000	Auxílio à Pesquisa - Regular	Ciências Sociais Aplicadas	2019-11-01	2020-10-31	0.000000	0.000000	0	1	0	0	0.134380
4	19/08972-8	Diogo Teruo Hashimoto	UNESP	Diogo Teruo Hashimoto	0.043478	Auxílio à Pesquisa - Regular	Ciências Agrárias	2019-09-01	2020-08-31	0.333333	0.000000	1	1	1	1	0.134380
...	...	...	...	...	...	...	...	...	...	...	...	...	...	...	...	...
6205	11/23781-2	Rosa Maria Rodrigues Pereira	USP	Rosa Maria Rodrigues Pereira	0.000000	Auxílio à Pesquisa - Regular	Ciências da Saúde	2012-05-01	2016-01-31	0.000000	0.083333	1	1	1	1	0.627268
6206	11/51843-2	Jose Antonio Marengo Orsini	INPE	Jose Antonio Marengo Orsini	0.000000	Auxílio à Pesquisa - Regular	Ciências Exatas e da Terra	2012-04-01	2016-03-31	0.333333	0.000000	1	0	1	1	0.671408
6207	11/20435-6	Gilles Landman	UNIFESP	Gilles Landman	0.000000	Auxílio à Pesquisa - Regular	Ciências da Saúde	2012-03-01	2016-02-29	0.000000	0.000000	1	1	0	1	0.671408
6208	11/10062-8	Paula Ayako Tiba	UFABC	Paula Ayako Tiba	0.130435	Auxílio à Pesquisa - Regular	Ciências Humanas	2011-11-01	2016-02-29	0.000000	0.000000	1	1	1	1	0.730750
6209	10/52212-3	Wagner Cotroni Valenti	UNESP	Wagner Cotroni Valenti	0.000000	Auxílio à Pesquisa - Programa de Pesquisa sobr...	Ciências Agrárias	2011-03-01	2016-02-29	0.000000	0.000000	1	1	1	1	0.850907
6210 rows × 16 columns
Heat Map
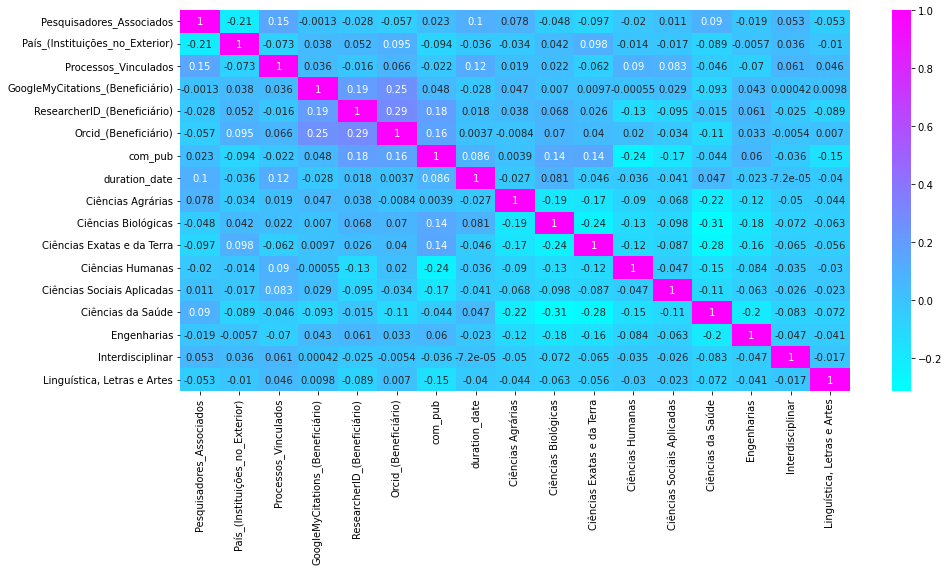
After one hot encoding, let's check correlation between fields.Check the good explanation bellow on how to read a correlation matrix:
https://www.statology.org/how-to-read-a-correlation-matrix/
This is more related to feature-selection, based on the correlation matrix:
https://medium.com/analytics-vidhya/feature-selection-feature-engineering-3bb09c67d8c5
df = df_normalized

dummy_gac = pd.get_dummies(df['Grande_Área_do_Conhecimento'])

df = pd.merge(
    left=df,
    right=dummy_gac,
    left_index=True,
    right_index=True,
)
fig, ax = plt.subplots(figsize=(15, 7))
colormap = sns.color_palette("Blues",48)
sns.heatmap(df.corr(), annot = True, cmap='cool')
plt.show()

Split Train and Test Data
Split data for train and test samples
X = df.drop(['N_Processo', 'Instituição' , 'Linha_de_Fomento' , \
             'Grande_Área_do_Conhecimento' , 'com_pub', \
             'Data_de_Início', 'Data_de_Término', \
             'Beneficiário', 'Pesquisador_Responsável'], axis=1)

y = df[['com_pub']]
X_train, X_test, y_train, y_test = train_test_split(X, y, test_size = 0.3, random_state=42)
y_train = y_train.values.ravel()
Principal component analysis (PCA)
Linear dimensionality reduction using Singular Value Decomposition
A page explanation about PCA and dimensionality reduction:
https://en.wikipedia.org/wiki/Principal_component_analysis
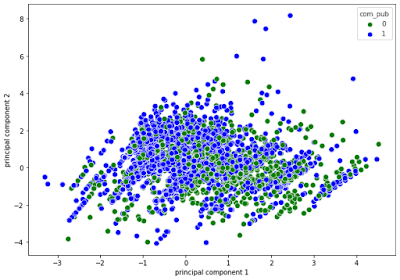
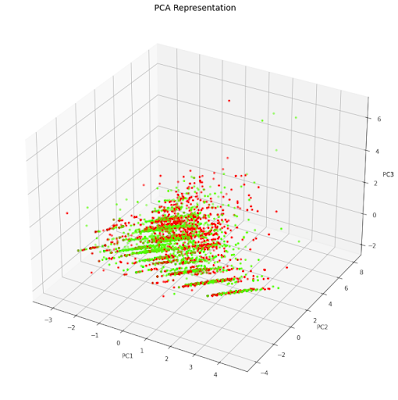
At a first glance, in the 2D plot, it looks like the points are very mixed. In the 3d plot however, you can see more sparced values viewing one more dimension.
from sklearn.preprocessing import StandardScaler
from mpl_toolkits.mplot3d import Axes3D
from sklearn.decomposition import PCA

import warnings
warnings.filterwarnings("ignore", category=DeprecationWarning)

scaler = StandardScaler()
scaler.fit(X)
X_Scale = scaler.transform(X)

# 2 dimensions plot
pca2 = PCA(n_components=2, random_state=2020)
principalComponents = pca2.fit_transform(X_Scale)
principalDf = pd.DataFrame(data = principalComponents, columns = ['principal component 1', 'principal component 2'])

finalDf = pd.concat([principalDf, y], axis = 1)

plt.figure(figsize=(10,7))
sns.scatterplot(x = finalDf['principal component 1'],
                y = finalDf['principal component 2'],
                s=70, hue=finalDf['com_pub'],
                palette=['green', 'blue'])


# 3 dimensions plot
pca3 = PCA(n_components=3)
principalComponents = pca3.fit_transform(X_Scale)
principalDf = pd.DataFrame(data = principalComponents, columns = ['principal component 1', 'principal component 2', 'principal component 3'])

finalDf = pd.concat([principalDf, df[['com_pub']]], axis = 1)
finalDf.head()

fig = plt.figure(figsize=(9,9))
axes = Axes3D(fig)
axes.set_title('PCA Representation', size=14)
axes.set_xlabel('PC1')
axes.set_ylabel('PC2')
axes.set_zlabel('PC3')

axes.scatter(finalDf['principal component 1'],finalDf['principal component 2'],finalDf['principal component 3'],c=finalDf['com_pub'], cmap = 'prism', s=10)


